Major Financial Indicators
- QUICK CO., LTD Home>
- IR Information>
- Major Financial Indicators
-
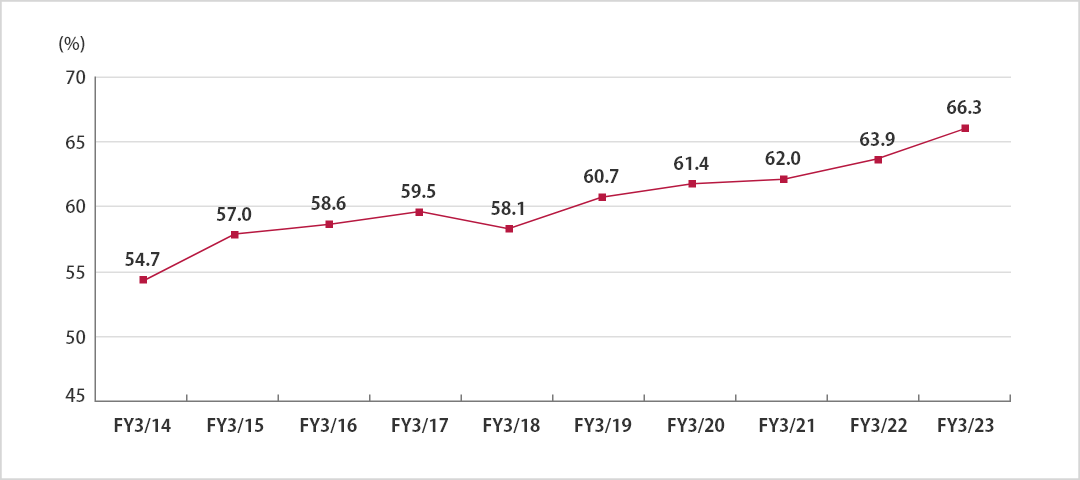
Gross margin
-
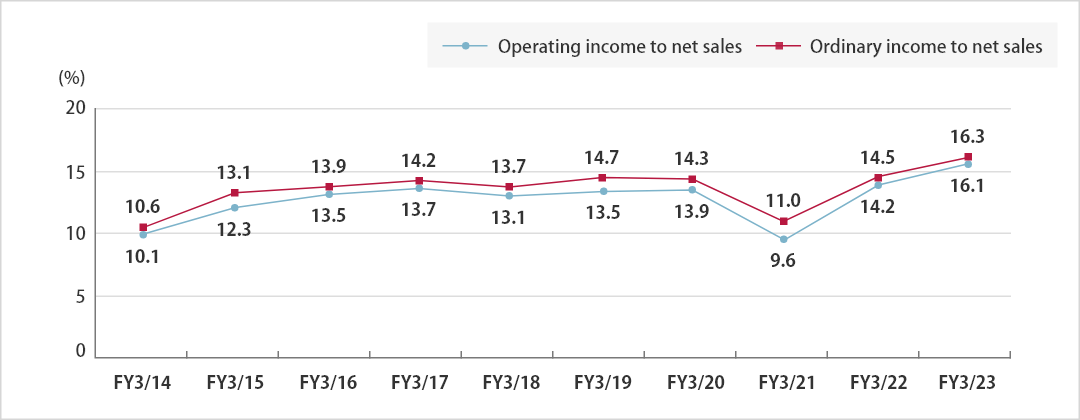
Operating income / Ordinary income to net sales
-
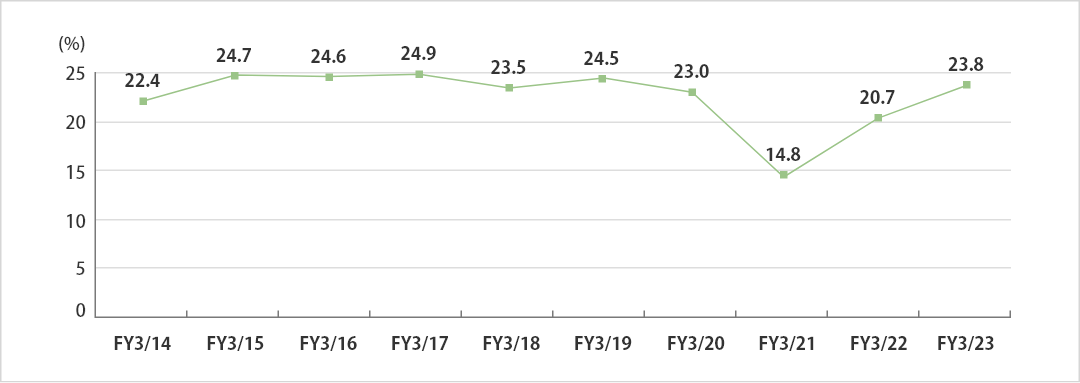
Ordinary income to total assets(ROA) *1
-
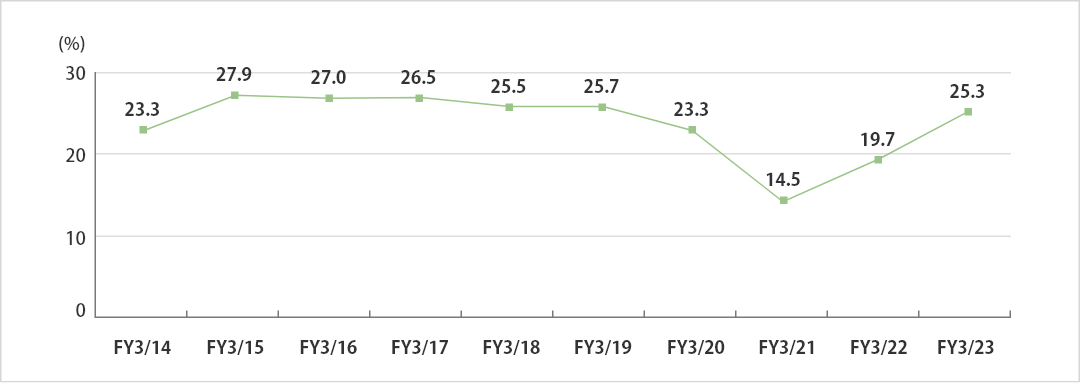
Return on Equity(ROE) *2
-
Shareholders’ equity ratio
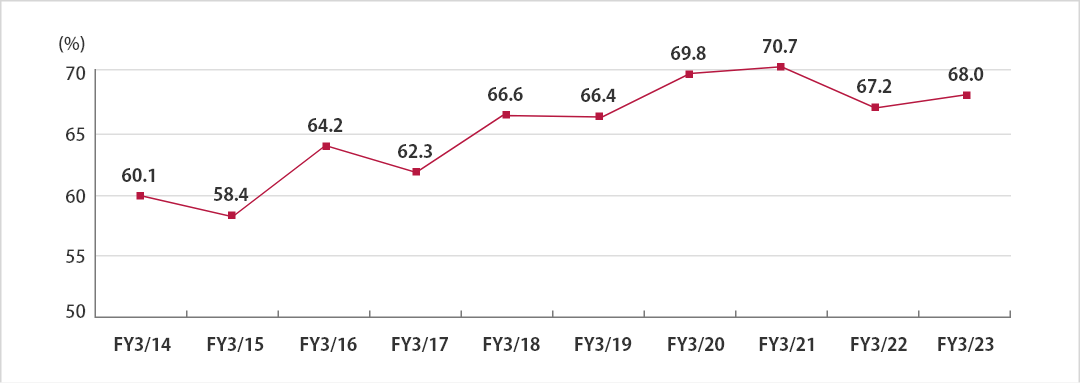
Major Financial Indicators (Consolidated)
Financial Information Data
| 36th | 37th | 38th | 39th | 40th | 41th | 42th | 43th | 44th | 45th | |
|---|---|---|---|---|---|---|---|---|---|---|
| period FY3/16 |
period FY3/17 |
period FY3/18 |
period FY3/19 |
period FY3/20 |
period FY3/21 |
period FY3/22 |
period FY3/23 |
period FY3/24 |
period FY3/25 |
|
| Gross margin(%) | 58.6 | 59.5 | 58.1 | 60.7 | 61.4 | 62.0 | 63.9 | 66.3 | 67.5 | 65.8 |
| Operating income to net sales(%) |
13.5 | 13.7 | 13.1 | 13.5 | 13.9 | 9.6 | 14.2 | 16.1 | 16.8 | 13.9 |
| Ordinary income to net sales(%) |
13.9 | 14.2 | 13.7 | 14.7 | 14.3 | 11.0 | 14.5 | 16.3 | 17.1 | 14.2 |
| Ordinary income to total assets(%) (ROA)*1 |
24.6 | 24.9 | 23.5 | 24.5 | 23.0 | 14.8 | 20.7 | 23.8 | 23.8 | 19.6 |
| Return on Equity(%) (ROE) *2 |
27.0 | 26.5 | 25.5 | 25.7 | 23.3 | 14.5 | 19.7 | 25.3 | 23.3 | 20.9 |
| Shareholders’ equity ratio(%) |
64.2 | 62.3 | 66.6 | 66.4 | 69.8 | 70.7 | 67.2 | 68.0 | 74.5 | 71.0 |
- *1:ROA = Ordinary income / Average total assets during the period
- *2:ROE = Profit attributable to owners of parent / Average total shareholders’ equity during the period
Note:1)Effective from the beginning of FY3/19 under review, the Company applied the Partial Amendments to Accounting Standard for Tax Effect Accounting (ASBJ Statement No. 28, February 16, 2018) and other related pronouncements. In addition, this change is reflected in the main management indicators of FY3/18.
Note:2)Beginning with the first quarter of FY3/22, the Company has applied Accounting Standard for Revenue Recognition. All figures for FY3/21 have been adjusted retroactively to conform with this accounting standard.